Short Answer: Eyewear fitting apps work in three stages — face shape classification using facial landmark detection, frame geometry matching based on contrast principles (angular frames for round faces, round frames for square faces), and PD measurement for optical centration. The combination reduces ill-fitting orders and return rates for optical retailers who deploy these tools online or in-store.
The Three Technical Layers Behind Frame Matching
Modern eyewear fitting apps are not a single feature. They stack three distinct technologies, each solving a different fitting problem.
| Layer | What It Does | Data Input | Output |
|---|---|---|---|
| Face Shape Detection | Classifies face geometry | Selfie or live camera | Face shape category |
| Frame Geometry Matching | Recommends frames by contrast rule | Face shape + measurements | Frame shortlist |
| PD Measurement | Locates pupil centers for centration | Photo with reference object | Monocular/binocular PD in mm |
Each layer is independent. A retailer can deploy all three, or use only the face shape and frame matching layers for a virtual try-on without optical measurement. Clinically, however, PD measurement is the most consequential step for prescription accuracy.
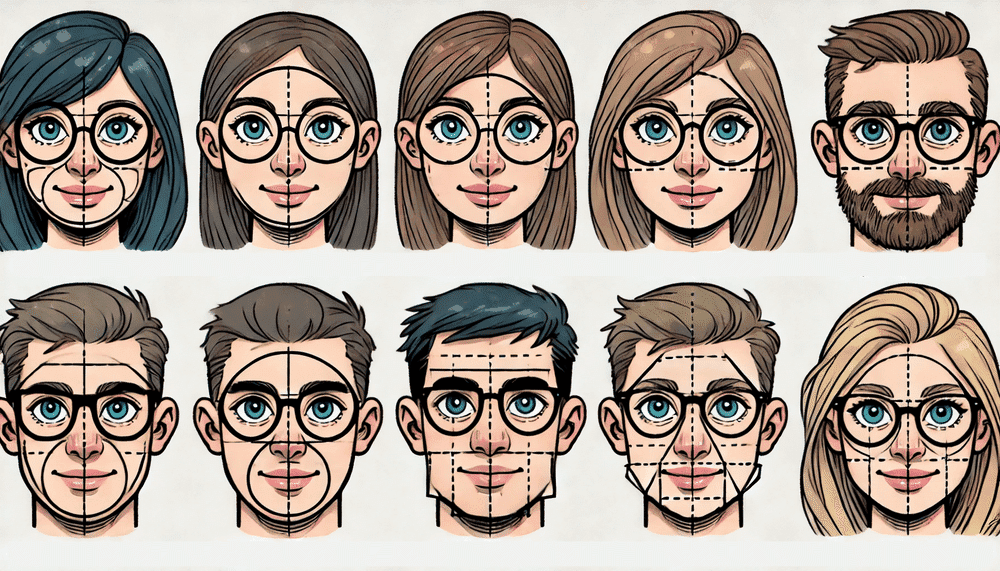
How Face Shape Detection Works
Face shape detection algorithms identify 68 or more facial landmarks — points along the jawline, cheekbones, temples, and hairline — and compute the ratio between face width and face length. The result maps to one of the classic geometric categories used in frame selection.
The seven categories used in clinical and retail practice:
| Face Shape | Key Proportion | Recommended Frame Contrast |
|---|---|---|
| Round | Width and length roughly equal | Rectangular, angular, cat-eye |
| Oval | Length exceeds width; balanced jaw and forehead | Most shapes; avoid oversizing |
| Square | Strong jaw, wide forehead, similar width/length | Round, oval, rimless |
| Rectangular | Long and narrow; jaw and forehead similar width | Round, oval, oversized |
| Triangular | Wider jaw, narrower forehead | Top-heavy frames, cat-eye, semi-rimless |
| Heart | Wide forehead, narrow jaw | Oval, light bottom frames, aviator |
| Diamond | Narrow forehead and jaw, wide cheekbones | Oval, cat-eye, rimless |
The underlying logic is contrast: frames that introduce curves soften angular faces; frames with defined angles add structure to round faces. Research published in Ophthalmic and Physiological Optics confirms that “frame appearance in the context of facial features” is the primary driver of patient satisfaction in optical dispensing, not brand or material alone. For a professional frame selection guide covering materials, physical fit parameters, and lens interactions, see the full eyeglass frames reference.
Frame Geometry: The Three Measurements That Determine Fit
Face shape tells you what style to recommend. Frame geometry tells you whether a frame will actually fit. Opticians use three frame measurements, and fitting apps must account for all three.
Lens width runs from 40 mm to 60 mm for most adult frames. The outer edge of the frame should align with the widest point of the face. Frames that are too narrow create visual crowding; frames that are too wide slide toward the nose.
Bridge width spans 14 mm to 24 mm. The bridge must contact the nose without creating pressure points or leaving gaps. For patients with a flat nose bridge, standard bridge widths frequently fail — a design limitation documented in anthropometric research on spectacle frames across different populations.
Temple length is most commonly 135 mm, 140 mm, or 145 mm. The temple arm should extend straight to the ear without bending prematurely. Too short a temple causes the frame to sit forward; too long causes the arm to angle downward behind the ear.
A 2023 parametric design study in the journal Heliyon found that the nose bridge is “the most problematic fit area” in frame design, requiring morphologically accurate 3D contours rather than simple width dimensions to achieve reliable comfort across diverse populations. The study also established that vertex distance — the space between lens and pupil — should fall within 8–20 mm to balance optical correction with comfort.
PD Measurement: The Step That Determines Optical Accuracy
Pupillary distance (PD) is the measurement that directly affects prescription performance. An incorrectly centered lens induces unwanted prism, causing eyestrain, headaches, and blurred vision — particularly at higher prescriptions and in progressive lenses.
Why measurement method matters:
A 2024 comparative study published in Clinical Optometry (PMC11654209) measured PD in the same subjects using four methods:
| Method | Mean Distance IPD (mm) | Notes |
|---|---|---|
| Pupillometer | 64.2 ± 3.5 | Clinical reference standard |
| PD ruler | 64.8 ± 3.6 | Largest measurements; examiner-dependent |
| Autorefractor | 64.4 ± 3.8 | Instrument-dependent |
| Mobile app | 63.6 ± 3.5 | Smallest measurements; convenient |
The study found that “mobile app resulted in significantly smaller distance IPD measurements than other methods,” with the mean difference between the pupillometer and mobile app at “−0.59 ± 1.17 mm.” Critically, the induced prism from this discrepancy remained within the ISO 16034:2002 acceptable tolerance of 0.33 prism diopters for most prescriptions — meaning well-designed apps produce clinically acceptable results for the majority of patients.
A separate 2023 study in Cureus comparing three smartphone apps found that app accuracy varied substantially by design. The best-performing app achieved a mean absolute error of 0.511 mm, while the worst reached 1.375 mm. The authors attributed the accuracy gap to “the more organized, stepwise instructions provided by the application during IPD measurement.”
The clinical implication for optical retailers: not all PD apps are equivalent. Structured guidance, user confirmation steps, and a reference object for scale (such as a credit card or Optogrid’s digital calibration system) consistently outperform apps that rely on uncalibrated image estimation.
For a detailed comparison of PD measurement methods and accuracy thresholds, see our guide on comparing 4 pupillary distance measurement methods.
What Happens When PD Is Wrong in Online Orders
The clinical stakes of measurement error are documented. A study by Gordon et al. cited in Cureus found that “nearly one out of 10 eyeglasses ordered online failed to meet the national optical quality standards” — a significant improvement over a 2011 study that found approximately 45% failure rates, but still a meaningful error rate that PD measurement apps directly address.
For progressive lens wearers, tolerances are tighter. The ISO 21987:2009 standard sets a manufacturing tolerance for progressive lens monocular centration at 1 mm — leaving little margin for measurement error upstream. This makes calibrated digital PD tools, rather than ruler-based estimation, essential for progressive lens online dispensing.
See our segment height guide for progressive lenses for the fitting tolerances that apply beyond PD.
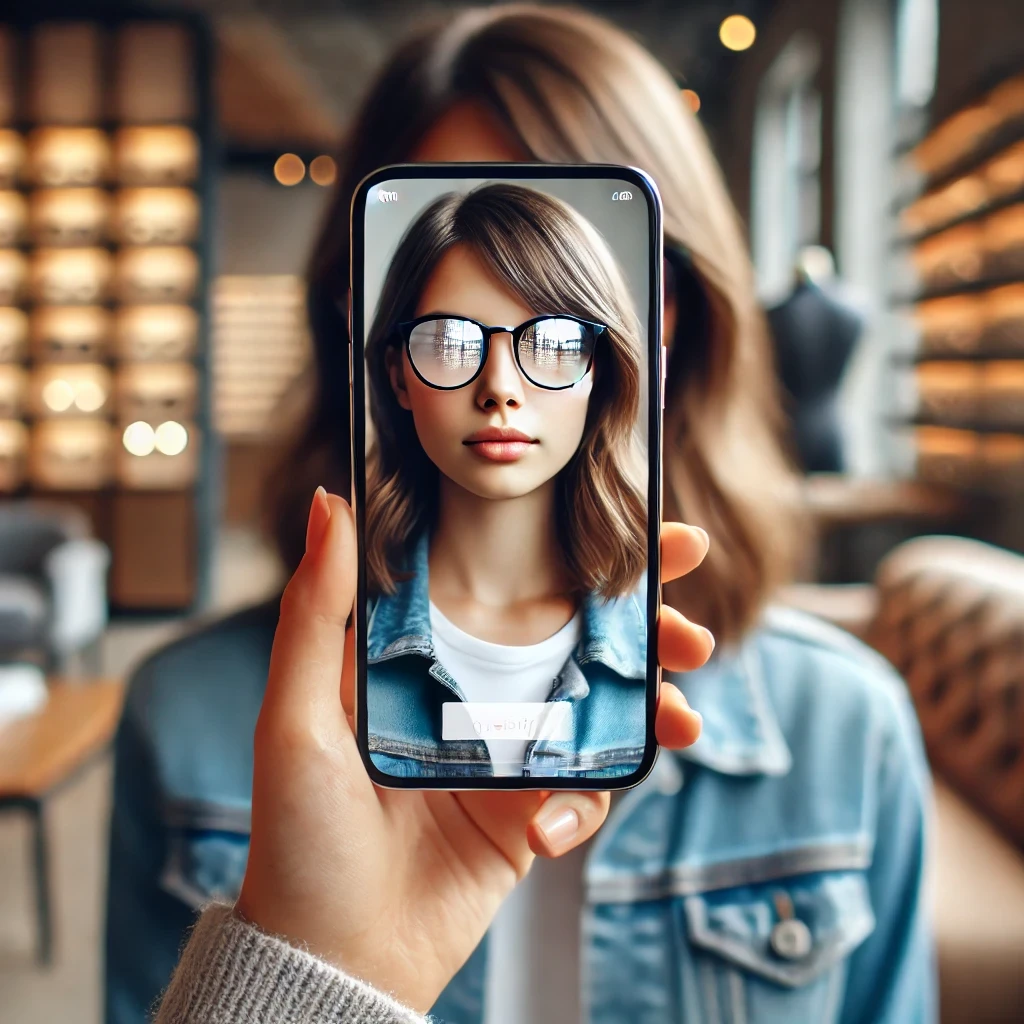
Virtual Try-On: Frame Matching Before Commitment
Virtual try-on sits at the intersection of face shape detection and frame geometry matching. It overlays a 3D frame model onto a live camera feed or uploaded photo, allowing the patient to evaluate style and proportional fit before selecting a frame.
The technology uses the same facial landmarks as face shape detection, but applies them differently: the algorithm places frame anchor points at the nose bridge, temple corners, and ear positions to simulate how the physical frame would sit.
Measured outcomes for retailers using virtual try-on:
- Returns decrease by up to 28% as shoppers gain more confidence in their purchase decisions (Deloitte, 2024)
- Online eyewear stores using virtual fitting tools see a 22% decrease in cart abandonment (Shopify Insights, 2025)
- 29% of glasses shoppers have already used virtual try-on technology at least once, more than doubling from 13% in 2022 (Fittingbox/Episto survey, January 2025)
The critical distinction for optical professionals: virtual try-on evaluates aesthetics and proportional fit. It does not replace PD measurement for prescription centration. A patient can find the right style through virtual try-on and still receive an incorrectly centered lens if PD data is missing or inaccurate.
For a practical evaluation of what virtual try-on tools deliver and where they fall short, see our analysis of virtual try-on in eyewear retail.
Special Fitting Considerations for Progressive Lens Wearers
Progressive lens wearers face fitting constraints that go beyond face shape and PD. Two additional measurements are required:
Segment height (SH): The vertical distance from the bottom of the frame to the center of the pupil. If segment height is too low, the patient cannot access the reading zone without tilting their head excessively. If too high, distance vision is compromised by the intermediate corridor.
Pantoscopic tilt: The vertical angle of the frame relative to the face. Most progressive lenses are designed for 8–12 degrees of pantoscopic tilt. A frame that sits too flat or too steep shifts the optical centers away from their intended positions.
Fitting apps that only capture PD miss both of these variables. For progressive lens patients, the complete digital measurement set includes monocular PD, segment height, and pantoscopic angle — all measurable via photo-based tools like Optogrid.
For more on the complete prescription fitting process, see The Essential Guide to Prescription Lens Fitting.
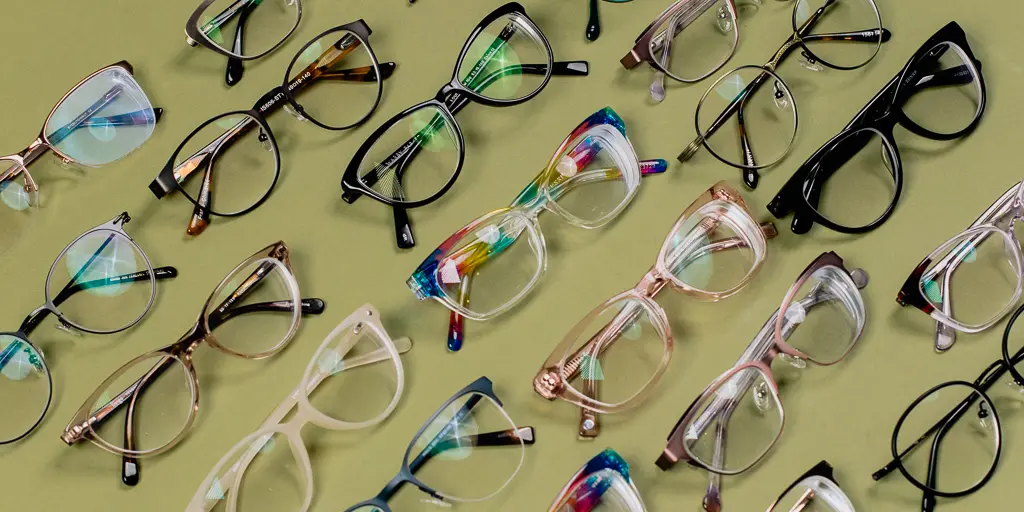
Frame Selection by Face Shape: Quick Reference
For opticians advising patients or configuring recommendation filters in fitting software, the established contrast rules are:
Round face: Angular frames add definition. Rectangular, square, or geometric shapes work well. Avoid round or oval frames that echo the face shape.
Oval face: The most flexible category. Most frame shapes are appropriate; prioritize proportional balance over shape. Avoid frames that are wider than the widest part of the face.
Square face: Round or oval frames soften the jawline. Rimless and semi-rimless options reduce visual weight. Avoid rectangular or square frames.
Rectangular face: Oversized or wide frames shorten visual length. Round and oval shapes add width. Avoid narrow, elongated frames.
Triangular face (wider jaw): Top-heavy frames — cat-eye, D-shaped, or frames with prominent upper rims — balance the wider jaw. Avoid bottom-heavy or rimless styles.
Heart-shaped face: Frames wider at the bottom, such as aviator or oval styles, balance a wide forehead. Light-colored frames and rimless options reduce visual weight at the top.
Diamond face: Oval, cat-eye, and rimless frames work with naturally balanced proportions. Avoid narrow frames that emphasize facial width at the cheekbones.
For a detailed guide to round face frame selection with fitting examples, see How to Choose Glasses for a Round Face. Frame color guidance based on skin undertone is covered in the color analysis for eyewear guide. For applying these recommendations in remote or online sales workflows, see the remote eyewear fitting playbook.
How Optogrid Combines These Layers for Optical Professionals
Optogrid addresses the optical measurement component directly. The tool captures monocular PD and segment height from a patient photograph taken in the optical shop or remotely, using a physical reference object for calibration. Measurement results feed directly into the dispensing workflow.
This differs from consumer-facing fitting apps: Optogrid is designed for opticians who need ISO-compliant measurement data for lens fabrication orders, not just style recommendations. The result is a complete digital fitting record — frame style confirmed via patient consultation, PD and SH captured digitally, prescription documented — that reduces both dispensing errors and return rates.
For opticians looking to add remote measurement capability to their practice, see Remote Pupillary Distance Measurement: Technology and Business Impact.
FAQ: Eyewear Fitting Apps
What is the most accurate method for measuring PD with an app?
Apps that provide structured, step-by-step user guidance and require a physical reference object for scale (such as a credit card or a calibrated marker) consistently outperform apps that estimate distance from uncalibrated images. A 2023 study found accuracy varied from 0.51 mm to 1.38 mm mean error across three apps, with the difference attributable to interface design and instruction quality.
Can a fitting app replace an in-person optician consultation?
For style selection and frame geometry matching, fitting apps can substantially replicate the optician’s initial recommendation process. For progressive lens fitting, high-prescription centration, and patients with binocular vision issues, in-person measurement remains the clinical standard.
How many facial landmarks does face shape detection use?
Most commercial systems use 68 or more landmarks. Research-grade systems use 32 primary landmarks plus derived secondary dimensions to compute face wrap, pantoscopic angle, and bridge contour — data points that consumer apps do not typically calculate.
What PD tolerance applies to progressive lens orders?
ISO 21987:2009 sets a manufacturing tolerance of ±1 mm for progressive lens monocular centration. Combined with upstream measurement error, this leaves almost no margin — making digital measurement tools preferable to ruler methods for progressive lens online dispensing.
Does face shape change over time?
Facial structure changes gradually with age due to soft tissue redistribution and bone remodeling. A frame that fit well at 30 may feel different at 60. Most fitting apps base classification on current image data, so re-running the assessment during each pair purchase is advisable.
What frame measurements should a patient know before ordering online?
Three numbers: lens width (40–60 mm), bridge width (14–24 mm), and temple length (135–150 mm). These are usually printed on the inside of the temple arm of any existing frame. Most fitting apps auto-detect frame size from photos but cross-referencing with existing frame measurements improves accuracy.
How does virtual try-on differ from face shape analysis?
Face shape analysis classifies face geometry and recommends frame categories. Virtual try-on overlays a specific 3D frame model onto a live or static image of the patient’s face. They often run together but are technically separate processes — a retailer can offer one without the other.
What is the average pupillary distance for adults?
Based on 14,904 real-world measurements, average PD values differ by sex: approximately 64 mm for men and 62 mm for women, with a full population range of roughly 55–75 mm. See our average pupillary distance data post for the full breakdown by age and sex.

I grew up inside an optical shop. My mother likes to tell how, as a kid, I would watch eyeglasses being assembled, play with the tools, and draw on the back of service order slips. The family business taught me early what a precise measurement and work done right are worth.
I went on to spend more than twenty years as a software engineer, always keeping an eye on the optical world. Optogrid was born where the two meet: digital measurement technology (pupillary distance and fitting heights) built by someone who knows the dispensing counter from the inside.