
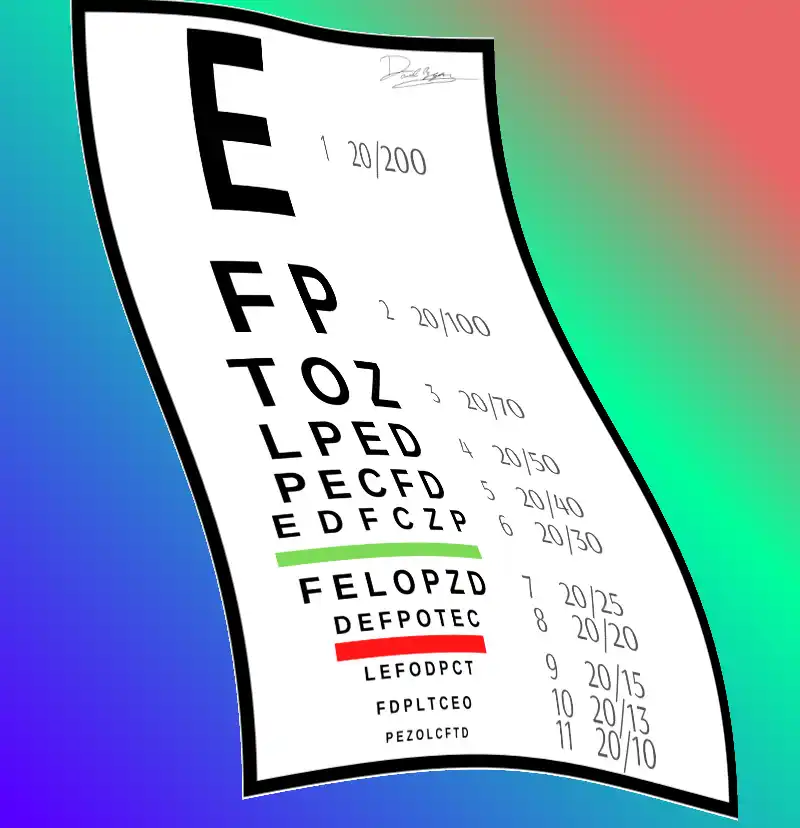
The Snellen chart is a standardized letter chart used to measure distance visual acuity. Herman Snellen, a Dutch ophthalmologist working at the Netherlands Hospital for Eye Patients in Utrecht, introduced it in 1862. Each letter (called an optotype) is built on a 5×5 grid where every stroke width subtends exactly one arcminute at the prescribed test distance, making the complete letter subtend five arcminutes. A result of 20/20 means a person reads at 20 feet what a person with normal acuity should read at 20 feet. Results worse than 20/20 (such as 20/40 or 20/200) indicate that the patient must be twice or ten times closer, respectively, to resolve what a normally-sighted person sees from the standard distance.
Herman Snellen and the Utrecht Eye Hospital, 1862
Before Snellen, measuring vision was an inconsistent practice. Eduard Jaeger von Jaxtthal, an Austrian ophthalmologist, had published near-vision reading samples in 1854 as an appendix to his book on cataract surgery. Those samples, printed by the Vienna State Printing House, used continuous text in progressively smaller typefaces to evaluate reading ability at close range. They became the first widely accepted near-vision test, but Jaeger never intended them as a rigorous measurement standard, and they offered no reliable way to compare results between examiners or across visits.
Franciscus Donders, Snellen’s mentor at the newly founded Netherlands Hospital for Eye Patients in Utrecht, recognized the core problem: without standardized optotypes, two clinicians measuring the same patient could arrive at different results. Snellen approached the problem as an engineering challenge rather than a clinical convention.
In 1862, Snellen published Optotypi ad visum determinandum and introduced optotypes: letterforms designed not from existing typefaces but from a strict geometric rule. Each character was constructed on a 5×5 grid of equal squares. The total letter height occupied five grid units; each stroke occupied one grid unit. At the prescribed test distance, that single-unit stroke would subtend exactly one arcminute of arc, and the whole letter would subtend five arcminutes. This angular relationship, rather than the physical size of the letter, was the innovation. Snellen expressed results as the fraction d/D: d is the distance at which the patient can just resolve the test letter, and D is the distance at which a person with normal acuity resolves the same letter. A person reading the 20/20 line at 20 feet achieves d/D = 20/20; a person who must step to 10 feet to read the same line achieves 10/20.
According to a historical review in Ned Tijdschr Geneeskd (2012, PMID 22510417), Snellen became Donders’ assistant in 1858, was appointed Professor of Ophthalmology at Utrecht in 1877, and succeeded Donders as hospital director in 1884. His optotype system became the global standard because it tied measurement to a reproducible physical principle rather than typographic convention.
The Geometry Behind 20/20: Why Five Arcminutes?
The choice of five arcminutes as the target subtense was not arbitrary. Research in the nineteenth century had established that the minimum angle of resolution (MAR) for a normally-sighted eye under good lighting conditions is approximately one arcminute. To detect a letter, the eye must resolve not the whole letter but its individual features, principally the gaps between strokes. Snellen set each stroke at one arcminute and each gap at one arcminute, requiring the visual system to resolve detail at its physiological limit to read the smallest test line.
This means a 20/20 optotype at 20 feet subtends five arcminutes in total height. A 20/40 optotype subtends ten arcminutes at 20 feet. The relationship is linear: a 20/40 letter is geometrically twice the height of a 20/20 letter. To work this through concretely: at 20 feet (6.1 m), one arcminute of arc corresponds to approximately 1.75 mm. A 20/20 optotype is therefore about 8.7 mm tall (5 arcmin x 1.75 mm/arcmin). A 20/40 optotype, intended to be readable at twice the distance with the same angular subtense, is approximately 17.5 mm tall. Move that 20/40 letter from 20 feet to 40 feet and it again subtends five arcminutes, explaining why it defines the boundary of normal acuity at the extended distance.
How a Snellen Test Works in Practice
A standard Snellen test follows a simple protocol, though the details matter.
Distance. Charts are designed for a 20-foot (6-meter) test distance. At this distance, the standard 20/20 optotype subtends five arcminutes. Projection and digital charts can replicate the optical equivalent in smaller rooms using mirrors or software. Charts positioned too close or too far, even by a foot, shift every measurement.
Room lighting. The chart should be uniformly lit, typically 80-320 cd/m². Low-contrast conditions inflate apparent acuity loss; glare from adjacent windows can suppress acuity on the fine lines.
Monocular testing. One eye is covered with an opaque occluder while the other is tested. Binocular acuity, measured with both eyes open, typically reads one line better due to binocular summation.
Scoring. Conventional Snellen scoring records the lowest line on which the patient identifies the majority of letters (usually at least 50-60%). Line-by-line scoring is imprecise: a patient who reads three of five letters on the 20/20 line is reported as 20/25, discarding two correct identifications.
Recording results. Results can be expressed four ways:
- Snellen fraction (feet): 20/20, 20/40, 20/200
- Snellen fraction (meters): 6/6, 6/12, 6/60
- Decimal: 1.0, 0.5, 0.1
- logMAR: 0.0, 0.3, 1.0
To convert Snellen to logMAR: divide the denominator by the numerator (this gives the MAR in arcminutes), then take the base-10 logarithm. For 20/40: MAR = 40/20 = 2; logMAR = log10(2) = 0.30. For 20/200: MAR = 200/20 = 10; logMAR = log10(10) = 1.0. Normal vision (20/20) yields logMAR = 0 because log10(1) = 0. The logMAR scale is linear in its underlying perceptual units, which is why it has largely replaced Snellen fractions in research.
The Major Chart Variants in Clinical Use
The Snellen chart spawned a family of variants, each addressing a specific limitation or use case. Understanding when to reach for each one is part of competent clinical practice.
| Chart / Optotype | Year Introduced | Optotype Type | Primary Use Case | Key Limitation |
|---|---|---|---|---|
| Snellen | 1862 | Roman letters | Routine distance VA screening | Variable letter count per line; non-geometric progression |
| Tumbling E | Late 1800s | Directional E | Non-literate adults, language barriers | Directional confusion with some patients |
| Landolt C (ISO 8596) | 1888 | Ring with gap | Legal/research standard; ISO reference | Gap direction can be guessed; requires careful instruction |
| Bailey-Lovie / LogMAR | 1976 | Sloan letters | Research; equal-step progression | Slower to administer; less familiar to patients |
| ETDRS | 1982 | Sloan letters | Clinical trials; reproducible research VA | Time-consuming; larger format chart needed |
| Sloan Letter Chart | 1959 | Sloan letters | Low vision, ETDRS-style clinical use | Letter set less familiar than Snellen alphabet |
| Lea Symbols | 1976 | Geometric shapes | Preverbal/pediatric (3-5 years) | Less sensitive than letter charts in older children |
| Allen Pictures | 1957 | Familiar objects | Pediatric (2-4 years) | Low resolution precision; optotype difficulty varies |
| Jaeger Near Card | 1854 | Graded text | Near vision assessment | Non-standardized; no angular specification |
| Digital/Projected | 1990s-present | Varies | High-volume clinical practice | Calibration and display luminance variation |
Tumbling E
The Tumbling E chart replaces all letters with a capital E rotated in four orientations (right, left, up, down). Patients indicate the direction the “legs” of the E point, either verbally or by turning their hand. This makes the chart usable with patients who cannot name letters due to language barriers, low literacy, or cognitive limitations. The test format requires that the examiner confirm the patient understands the task before testing, because some individuals with spatial processing difficulties conflate rotations.
Landolt C (ISO 8596)
The Landolt C is a ring with a gap cut at one of eight positions. Patients identify the gap direction. ISO 8596:2017 specifies the Landolt ring as the international reference optotype for visual acuity certification and licensing (passports, driving, aviation). The standard mandates chart luminance between 80 and 320 cd/m², with a recommended value of 200 cd/m². Unlike letter charts, the Landolt C has a single optotype with no per-letter legibility variation, which makes it the purest psychophysical acuity measure. Its limitation is that the eight gap positions allow a one-in-eight chance guess, versus one in about 26 for letter charts.
Bailey-Lovie / LogMAR Chart
Ian Bailey and Jan E. Lovie-Kitchin designed the LogMAR chart at the National Vision Research Institute of Australia in 1976, introducing three principles that the Snellen chart lacked. According to their original paper published in American Journal of Optometry and Physiological Optics (1976), the design requires: letters of equal legibility, the same number of letters on each row, and uniform between-letter and between-row spacing, combined with a logarithmic progression of letter size. This means each row is exactly 0.1 logMAR (26%) larger or smaller than adjacent rows, and each letter carries equal diagnostic weight. Scoring counts individual letters, not lines, giving 0.02 logMAR per letter.
ETDRS Chart
The Early Treatment Diabetic Retinopathy Study (ETDRS) adopted and refined the Bailey-Lovie design for its multicenter clinical trial, which enrolled 3,711 patients across 22 U.S. centers from 1979 to 1985. Ferris, Kassoff, and Bresnick developed the specific ETDRS visual acuity charts, published in American Journal of Ophthalmology in 1982, using 10 Sloan letters selected by Louise Sloan in 1959 for equal legibility (C, D, H, K, N, O, R, S, V, Z). Five letters appear on each row, arranged to produce rows of equal overall difficulty across charts using validated letter combinations. ETDRS is now the gold standard for interventional research because it generates reproducible, statistically comparable measurements. In the words of the StatPearls clinical reference on the Snellen chart: “The ETDRS chart was developed in 1982 to overcome the limitations of the Snellen chart, and has been found to be significantly more accurate and reproducible.”
Lea Symbols and Allen Pictures
For pediatric vision testing in children too young to name letters reliably, picture-based charts replace letter optotypes. Lea Symbols use four geometric shapes (circle, square, house, apple) selected to be equally recognizable at threshold. Allen pictures use objects familiar to young children (car, birthday cake, telephone, bird, horse, hand) and are suitable from approximately age two. Both are tested by matching or naming. Lea Symbols provide better psychometric properties than Allen pictures in preschool screening because the four optotypes have more uniform legibility.
Jaeger Near Vision Card
The Jaeger card tests near visual acuity by presenting graded reading text at approximately 35-40 cm. As noted in the historical record, Eduard Jaeger introduced the card in 1854, initially as an appendix to a cataract surgery text rather than as a formal measurement standard. It remains in widespread clinical use for near acuity screening. Its limitation is the lack of angular specification: the Jaeger numbering system (J1 through J11) is not standardized across manufacturers, so a J3 from one printer may not match J3 from another.
Digital and Projected Charts
Digital displays and chart projectors have largely replaced printed charts in high-volume practices. They allow single-instrument chart switching and reduce physical handling. The critical requirement is luminance calibration: the display must meet the same 80-320 cd/m² luminance standards as a printed chart. Uncalibrated consumer monitors can read 30-40% lower in luminance, systematically inflating measured acuity.
Where the Snellen Chart Falls Short
The Snellen chart’s design flaws are well documented and help explain when a more rigorous tool is needed.
Non-geometric line progression. The Snellen chart does not follow a uniform logarithmic step between rows. A 2010 prospective study published in Transactions of the American Ophthalmological Society and indexed on PubMed (PMID 20126505) confirmed that the size change between rows is uneven: roughly 60% at the large-letter end of the chart and 66% near the normal-acuity rows. This means a one-line change near 20/200 represents a larger absolute shift in acuity than a one-line change near 20/25, making Snellen scores non-comparable across the acuity range.
Variable letter count per line. The 20/200 line has one letter; the 20/20 line has eight or more depending on the chart version. More letters per row creates crowding, which suppresses measured acuity particularly in patients with amblyopia, where the crowding effect is exaggerated.
Unequal letter difficulty. Some letters are easier to identify than others. Research on the Snellen alphabet shows that A, L, and T are consistently easier to read at threshold while S, F, C, and B produce more errors. Because different rows contain different mixtures of letters, line-to-line comparisons carry a built-in legibility bias.
Imprecise scoring. Line-by-line scoring discards information. A patient who reads four of five letters on the 20/25 line and misses the entire 20/20 line is scored identically to a patient who reads all of 20/30 and nothing above it. The same score can hide very different underlying performance.
Statistical incompatibility. Non-linear row spacing and variable letter count make statistical operations on Snellen fractions (mean, standard deviation, regression) misleading. This is why clinical trials transitioned to logMAR scoring after ETDRS demonstrated a reproducible alternative.
A study published in Eye (2009, PMID 19557025) found 95% tolerance limits for test-retest change of ±0.14 logMAR for ETDRS, ±0.16 for compact reduced logMAR, and ±0.18 for Snellen. The ETDRS reproducibility advantage is modest for routine clinical decisions but becomes essential when detecting letter-level changes that determine treatment eligibility or trial outcomes.
Snellen vs. ETDRS vs. Landolt C: Choosing the Right Chart
Most opticians and ophthalmologists work with all three chart families without a deliberate protocol for when to use each. The following is a practical decision framework.
Use Snellen when:
- Screening unselected patients for refractive correction in a routine dispensing or general ophthalmology setting.
- Tracking stable patients where one-line precision is clinically adequate.
- Space or equipment limits prevent ETDRS setup.
Use ETDRS (logMAR scoring) when:
- Participating in or referring to a clinical trial that reports VA in logMAR.
- Monitoring a patient in low vision services, cataract surgery workup, or macular degeneration follow-up where detecting a 5-letter (one row) change has treatment implications.
- Your visual acuity documentation will be reviewed by a researcher or legal adjudicator.
- Assessing patients with blurry vision from conditions like macular disease, where Snellen’s imprecision near the bottom of the chart produces unreliable results.
Use Landolt C when:
- Performing a formal certification or legal assessment (driving license, aviation medical, workers’ compensation).
- Testing a patient who cannot reliably respond to letter optotypes.
- Standardizing results against ISO 8596 for a research protocol.
Use picture charts (Lea, Allen, HOTV) when:
- Testing a child under five who cannot reliably name or match letters.
- Screening for astigmatism or amblyopia in a pediatric population where letter-based charts produce inconsistent responses.
Combining chart types within a single encounter is appropriate. An optician might screen with Snellen, then refer for ETDRS testing before progressive lens fitting if the expected correction seems borderline.
Color vision testing is a separate clinical dimension. Snellen and its variants measure resolution acuity only; color discrimination requires pseudoisochromatic plates or anomaloscopy.
The Snellen Chart in Modern Clinical Practice
The Snellen chart’s durability in everyday practice reflects practical virtue as much as inertia. It is fast, inexpensive, portable, and familiar to every patient who has had an eye examination. In a busy optical shop or primary care office, a Snellen chart mounted at 20 feet gives a clinically adequate screening result in under two minutes per eye.
The transition to ETDRS in interventional research has not displaced Snellen from routine practice. A 2022 review of visual acuity testing history published in Eye noted that even 100 years after Snellen’s first publication, there was still no international standard optotype, a gap that ISO 8596 eventually addressed.
The practical reality is a two-tier system: Snellen for routine screening and dispensing, ETDRS for research and high-stakes treatment decisions. Opticians who understand both can document acuity in the format most useful for the next stage of care.
Frequently Asked Questions
What does 20/20 vision actually mean?
20/20 vision means you can read at 20 feet what a person with normal acuity should read at 20 feet. The numerator (20) is your test distance in feet; the denominator (20) is the distance at which a normative observer resolves the same letter. Normal acuity is defined by the angular subtense of the Snellen optotype: the full letter height subtends five arcminutes, and each stroke subtends one arcminute, at the standard distance. 20/20 is not the same as perfect vision; it describes a single dimension of spatial resolution and says nothing about contrast sensitivity, color vision, or peripheral field.
Why is the big E always on top of a Snellen chart?
The top letter corresponds to the poorest acuity testable at the standard distance, typically 20/200, where the letter subtends 50 arcminutes in height. Charts progress from largest at the top to smallest at the bottom so that patients begin at a size they can resolve, confirming the test task before moving to harder lines. The E appears there on many charts because it is unambiguous at large sizes; it carries no special geometric significance in Snellen’s original optotype set.
Is the Snellen chart still used in modern eye exams?
Yes. The Snellen chart remains the most widely used visual acuity test in routine clinical practice globally. Its main competition is ETDRS for research and Landolt C for certification. A 2009 study in Eye (PMID 19557025) found that the test-retest reproducibility advantage of ETDRS over Snellen was real but modest (±0.14 vs. ±0.18 logMAR), which is why most routine clinical settings have not adopted the slower ETDRS protocol. For screening and prescription verification, Snellen remains clinically adequate.
Snellen chart vs. logMAR: which is more accurate?
LogMAR charts (Bailey-Lovie and ETDRS) are more accurate and more reproducible than Snellen. They achieve this through three design improvements: equal legibility among all optotypes (using Sloan letters), the same number of letters per row (eliminating crowding variation), and a uniform logarithmic progression between rows (making a one-row change equal in perceptual magnitude anywhere on the chart). A computer simulation published on PubMed (PMID 26949621) reported test-retest variability of 0.23 logMAR for Snellen versus 0.11 logMAR for ETDRS. For clinical trials and treatment decisions sensitive to small acuity changes, logMAR is the appropriate choice.
Can I test my own vision at home with a printed Snellen chart?
Home testing can detect gross changes in acuity between professional visits but is not a substitute for a full examination. Common sources of error include incorrect print scale, non-standard test distance, and poor room lighting. A change of two or more lines versus a previously recorded result warrants prompt clinical follow-up. Home testing cannot measure refraction, assess binocular function, or evaluate media opacity.
Why isn’t the Snellen chart used in clinical trials?
Clinical trials require measurements that are reproducible across multiple examiners, multiple sites, and multiple time points. The Snellen chart’s variable letter count, non-linear row progression, and line-by-line scoring make its results statistically non-comparable across the acuity range. The ETDRS chart, adopted as the research standard following the Early Treatment Diabetic Retinopathy Study (1979-1989), provides letter-by-letter scoring and a uniform logarithmic scale, allowing researchers to detect clinically meaningful changes (typically five letters, or one logMAR row) with statistical confidence. Regulatory agencies including the FDA expect ETDRS-format VA data in submissions for ophthalmic drug and device approvals.
References
- van Leeuwen R, Eijkemans MJC. [Snellen and his optotypes]. Ned Tijdschr Geneeskd. 2012;156(16):A4416. https://pubmed.ncbi.nlm.nih.gov/22510417/
- Mäntyjärvi M, Laitinen T. A history of visual acuity testing and optotypes. Eye. 2023;37(2):196-207. https://pmc.ncbi.nlm.nih.gov/articles/PMC10764321/
- Bailey IL, Lovie JE. New design principles for visual acuity letter charts. Am J Optom Physiol Opt. 1976;53(11):740-745. https://www.semanticscholar.org/paper/New-Design-Principles-for-Visual-Acuity-Letter-Bailey-Lovie/48e307ec4eb704827a835a643691fb16cbf74a59
- Ferris FL, Kassoff A, Bresnick GH, Bailey I. New visual acuity charts for clinical research. Am J Ophthalmol. 1982;94(1):91-96. https://www.ncbi.nlm.nih.gov/books/NBK558961/
- Comparison of the ETDRS logMAR, compact reduced logMAR and Snellen charts in routine clinical practice. Eye. 2009. https://pubmed.ncbi.nlm.nih.gov/19557025/
- ISO 8596:2017. Ophthalmic optics — Visual acuity testing — Standard and clinical optotypes and their presentation. https://www.iso.org/standard/69042.html
- American Academy of Ophthalmology. All about the eye chart. https://www.aao.org/eye-health/tips-prevention/eye-chart-facts-history
- Carkeet A. Comparison of Snellen and ETDRS charts using a computer simulation. Optom Vis Sci. 2016;93(3):338-347. https://pubmed.ncbi.nlm.nih.gov/26949621/
- Snellen Chart. StatPearls. NCBI Bookshelf. https://www.ncbi.nlm.nih.gov/books/NBK558961/

I grew up inside an optical shop. My mother likes to tell how, as a kid, I would watch eyeglasses being assembled, play with the tools, and draw on the back of service order slips. The family business taught me early what a precise measurement and work done right are worth.
I went on to spend more than twenty years as a software engineer, always keeping an eye on the optical world. Optogrid was born where the two meet: digital measurement technology (pupillary distance and fitting heights) built by someone who knows the dispensing counter from the inside.